

How to Read Investment Performance: Why % Return Is the Least Informative Number
When someone shares their trading results, the go-to line is almost always: "I made 30% this month." And on the other side, the first question listeners ask circles around the same thing: "What's your return percentage?" In mainstream thinking, a strategy returning 50% is automatically better than 30% and utterly superior to 15%.
Yet this is precisely the biggest trap hidden in surface-level metrics. A raw percentage return tells you absolutely nothing about how much risk you took to achieve it. And in investing, a return without a risk measure attached is a meaningless number.
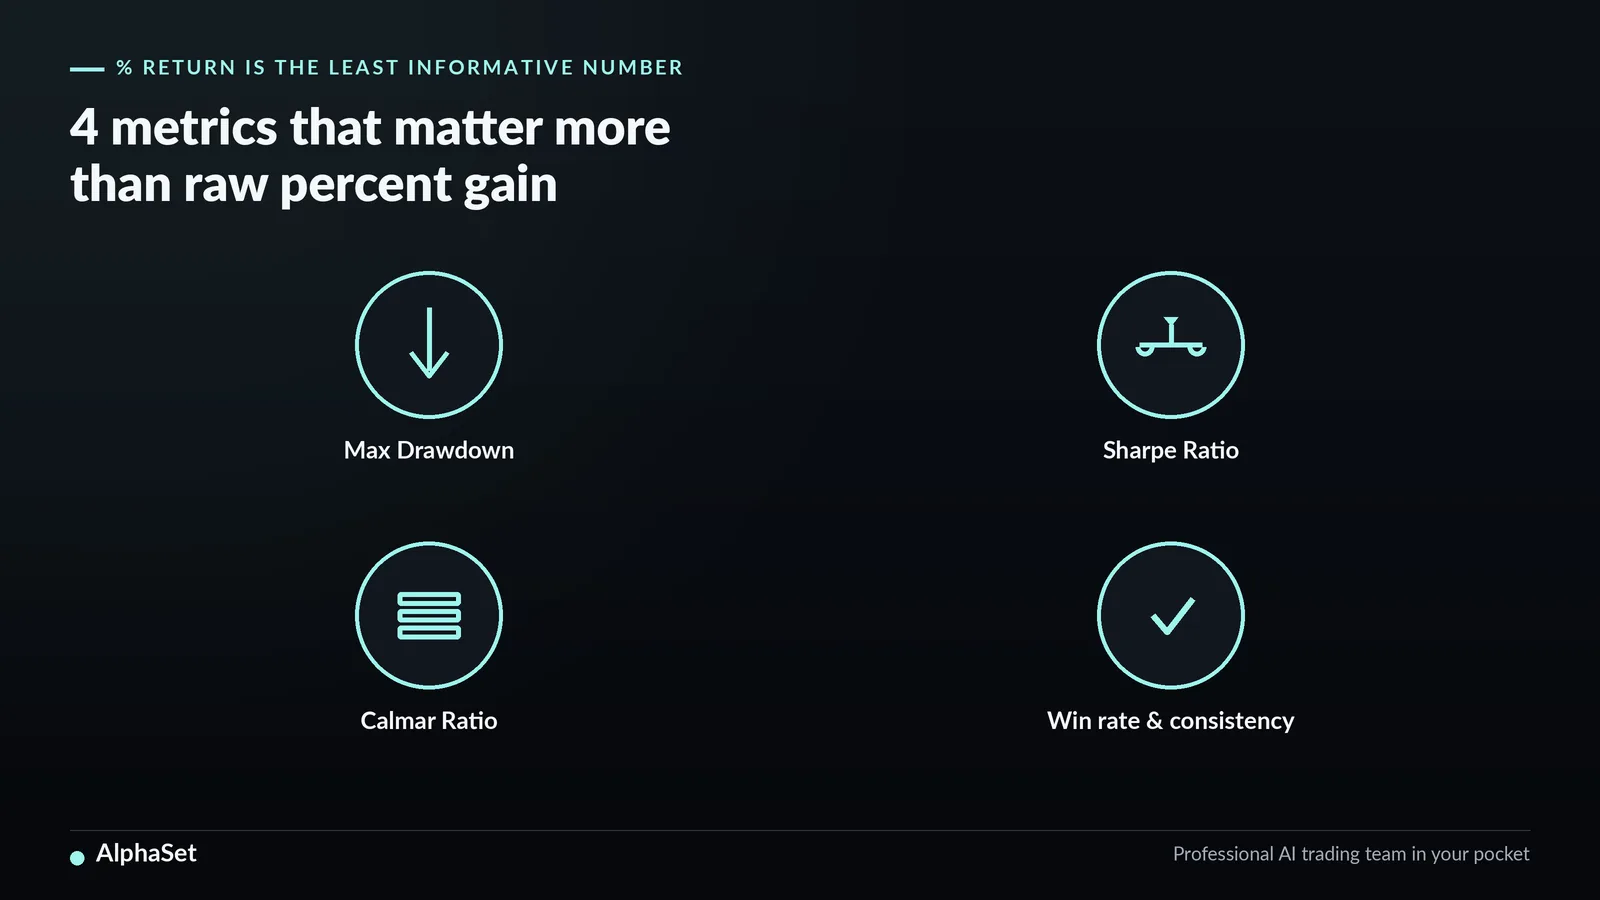
Drawdown: The Real Risk Metric Traders Most Often Ignore
Drawdown is the percentage decline from the highest peak to the lowest trough of a portfolio over a specific period. Maximum Drawdown (Max DD) is the largest such decline ever recorded in the history of that strategy.
Max DD is far more important than the return percentage, because it reflects the worst-case scenario you would face if you happened to enter capital right at the peak of a cycle.
A strategy returning 50% per year sounds extremely attractive — but if its Max DD reaches 80%, the real question is: do you have the discipline and composure to hold on while watching $100,000 shrink to just $20,000?
Most individual investors collapse at this stage. They panic, cut their losses at the deepest trough, and permanently forfeit the gains that would have come with the recovery.
It is also worth distinguishing between two drawdown states:
-
Short-term drawdown: Assets decline 20% over two weeks, then quickly establish a new high (localized sharp market volatility).
-
Extended drawdown (Drawdown Duration): Assets decline 20% but take eight months to break even again. Prolonged drawdown is what most devastatingly erodes an investor's psychology.
Sharpe Ratio: How Much Do You Earn per Unit of Risk?
The Sharpe Ratio measures the excess return of a strategy relative to a risk-free asset (such as a bank savings rate) per unit of volatility (the standard deviation of returns). The simplified formula is: return divided by volatility.
Which of the following two strategies is the superior choice?
-
Strategy A: 30% annual return, Sharpe Ratio = 0.8
-
Strategy B: 15% annual return, Sharpe Ratio = 2.0
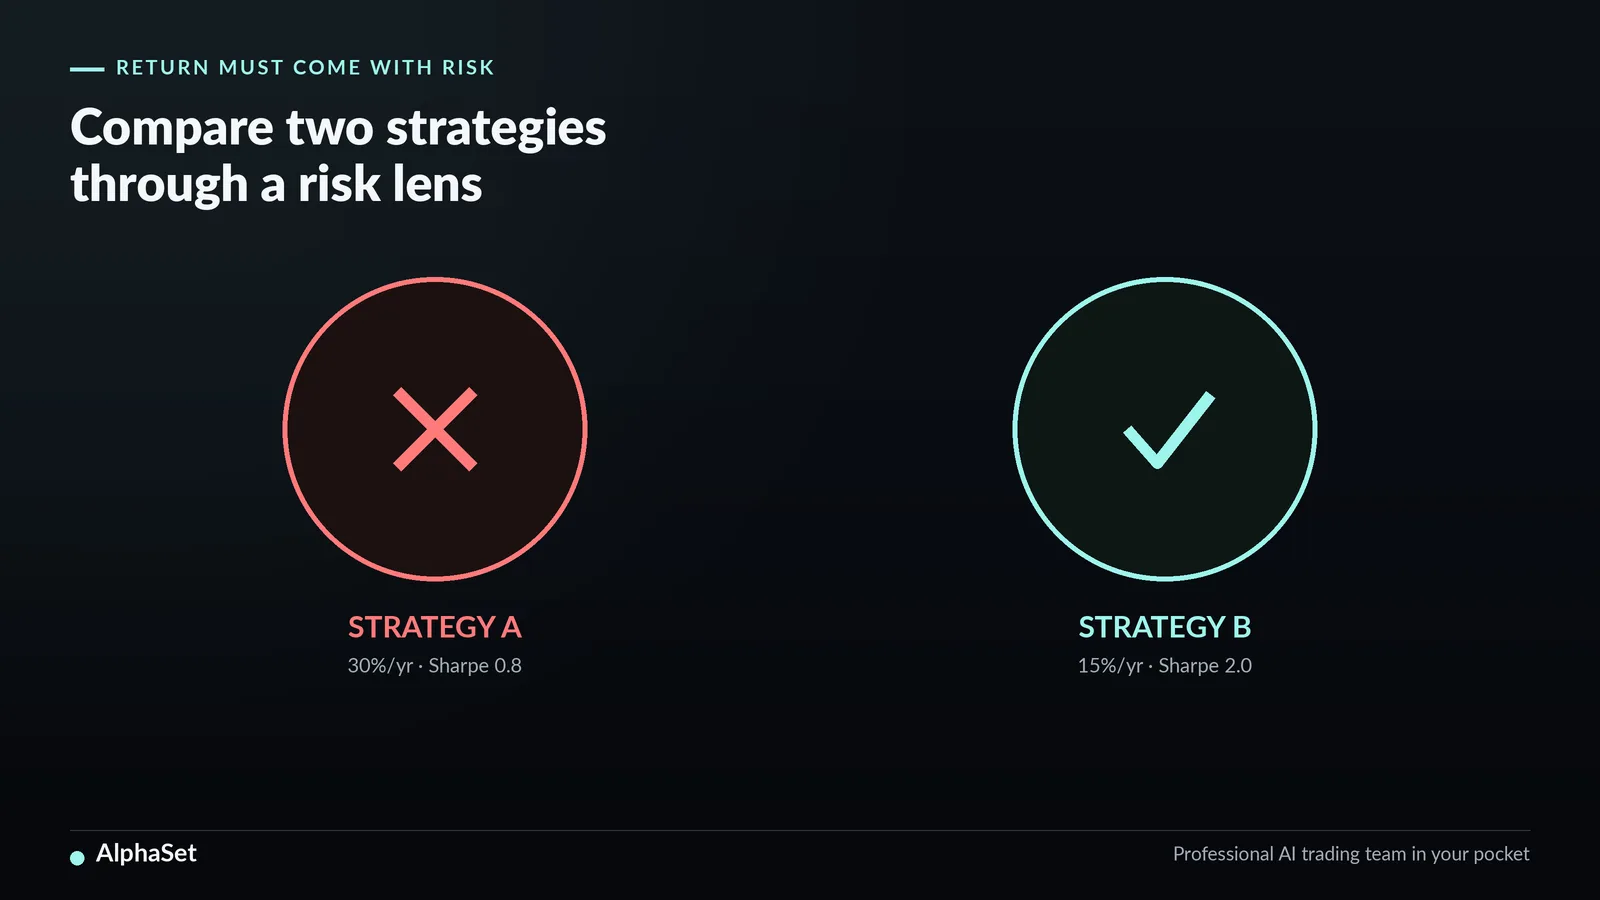
In terms of quality, Strategy B wins outright. With a Sharpe Ratio of 2.0, it generates exceptionally consistent returns. Over the long run, a smooth equity curve allows compounding to operate efficiently and produce superior outcomes, because the capital base is never interrupted or fractured by deep drawdowns.
A Sharpe Ratio above 1.0 is generally considered good. Above 2.0 is excellent. Below 0.5 is a signal that the strategy is taking on far too much risk relative to the returns it generates.
Calmar Ratio: Balancing Return Against Maximum Drawdown
Where the Sharpe Ratio uses overall volatility as its denominator, the Calmar Ratio divides annualized return by Max Drawdown.
For example: a strategy returning 40% per year with a Max DD of 20% has a Calmar Ratio of 2. A strategy returning 60% with a Max DD of 60% has a Calmar Ratio of 1.
The Calmar Ratio answers one direct question: "Given the worst loss this strategy has ever experienced, is the average return attractive enough?" A Calmar above 1 is considered adequate; above 2 is considered very good.
Win Rate and Consistency: The Quality of Returns Over Time
Beyond the three metrics above, two additional indicators worth examining are win rate and return consistency over time. A strategy whose strong performance is driven almost entirely by two or three exceptional months — with the remainder being losses or breakeven — is categorically different in quality from a strategy that produces positive returns consistently month after month.
High consistency also means compounding works more effectively. If Month 1 is +10%, Month 2 is −8%, and Month 3 is +10%, the cumulative result after three months is only approximately +11.7%. But if each month returns a steady +3.5%, the cumulative result is approximately +10.9%.
In the short term, the gap between the two portfolios appears modest. Stretched over three or five years, however, portfolios with large drawdown swings suffer serious compounding erosion compared to those that grow in a steady, progressive manner.
Evaluating the Full Set of Metrics with an Automated Tracking System
Most individual investors today look only at their account balance to assess performance. They have no tools or recording systems to calculate the Sharpe Ratio or systematically track Drawdown. The result is that they remain entirely blind to risks quietly accumulating beneath the surface — until a sharp crash hits and the account drops beyond their pain threshold, at which point it is already too late.
Without consistently monitoring these metrics, you cannot distinguish between a strategy operating within its expected volatility range and one that has genuinely lost its edge and needs refinement.
What Is Alpha Crypto?
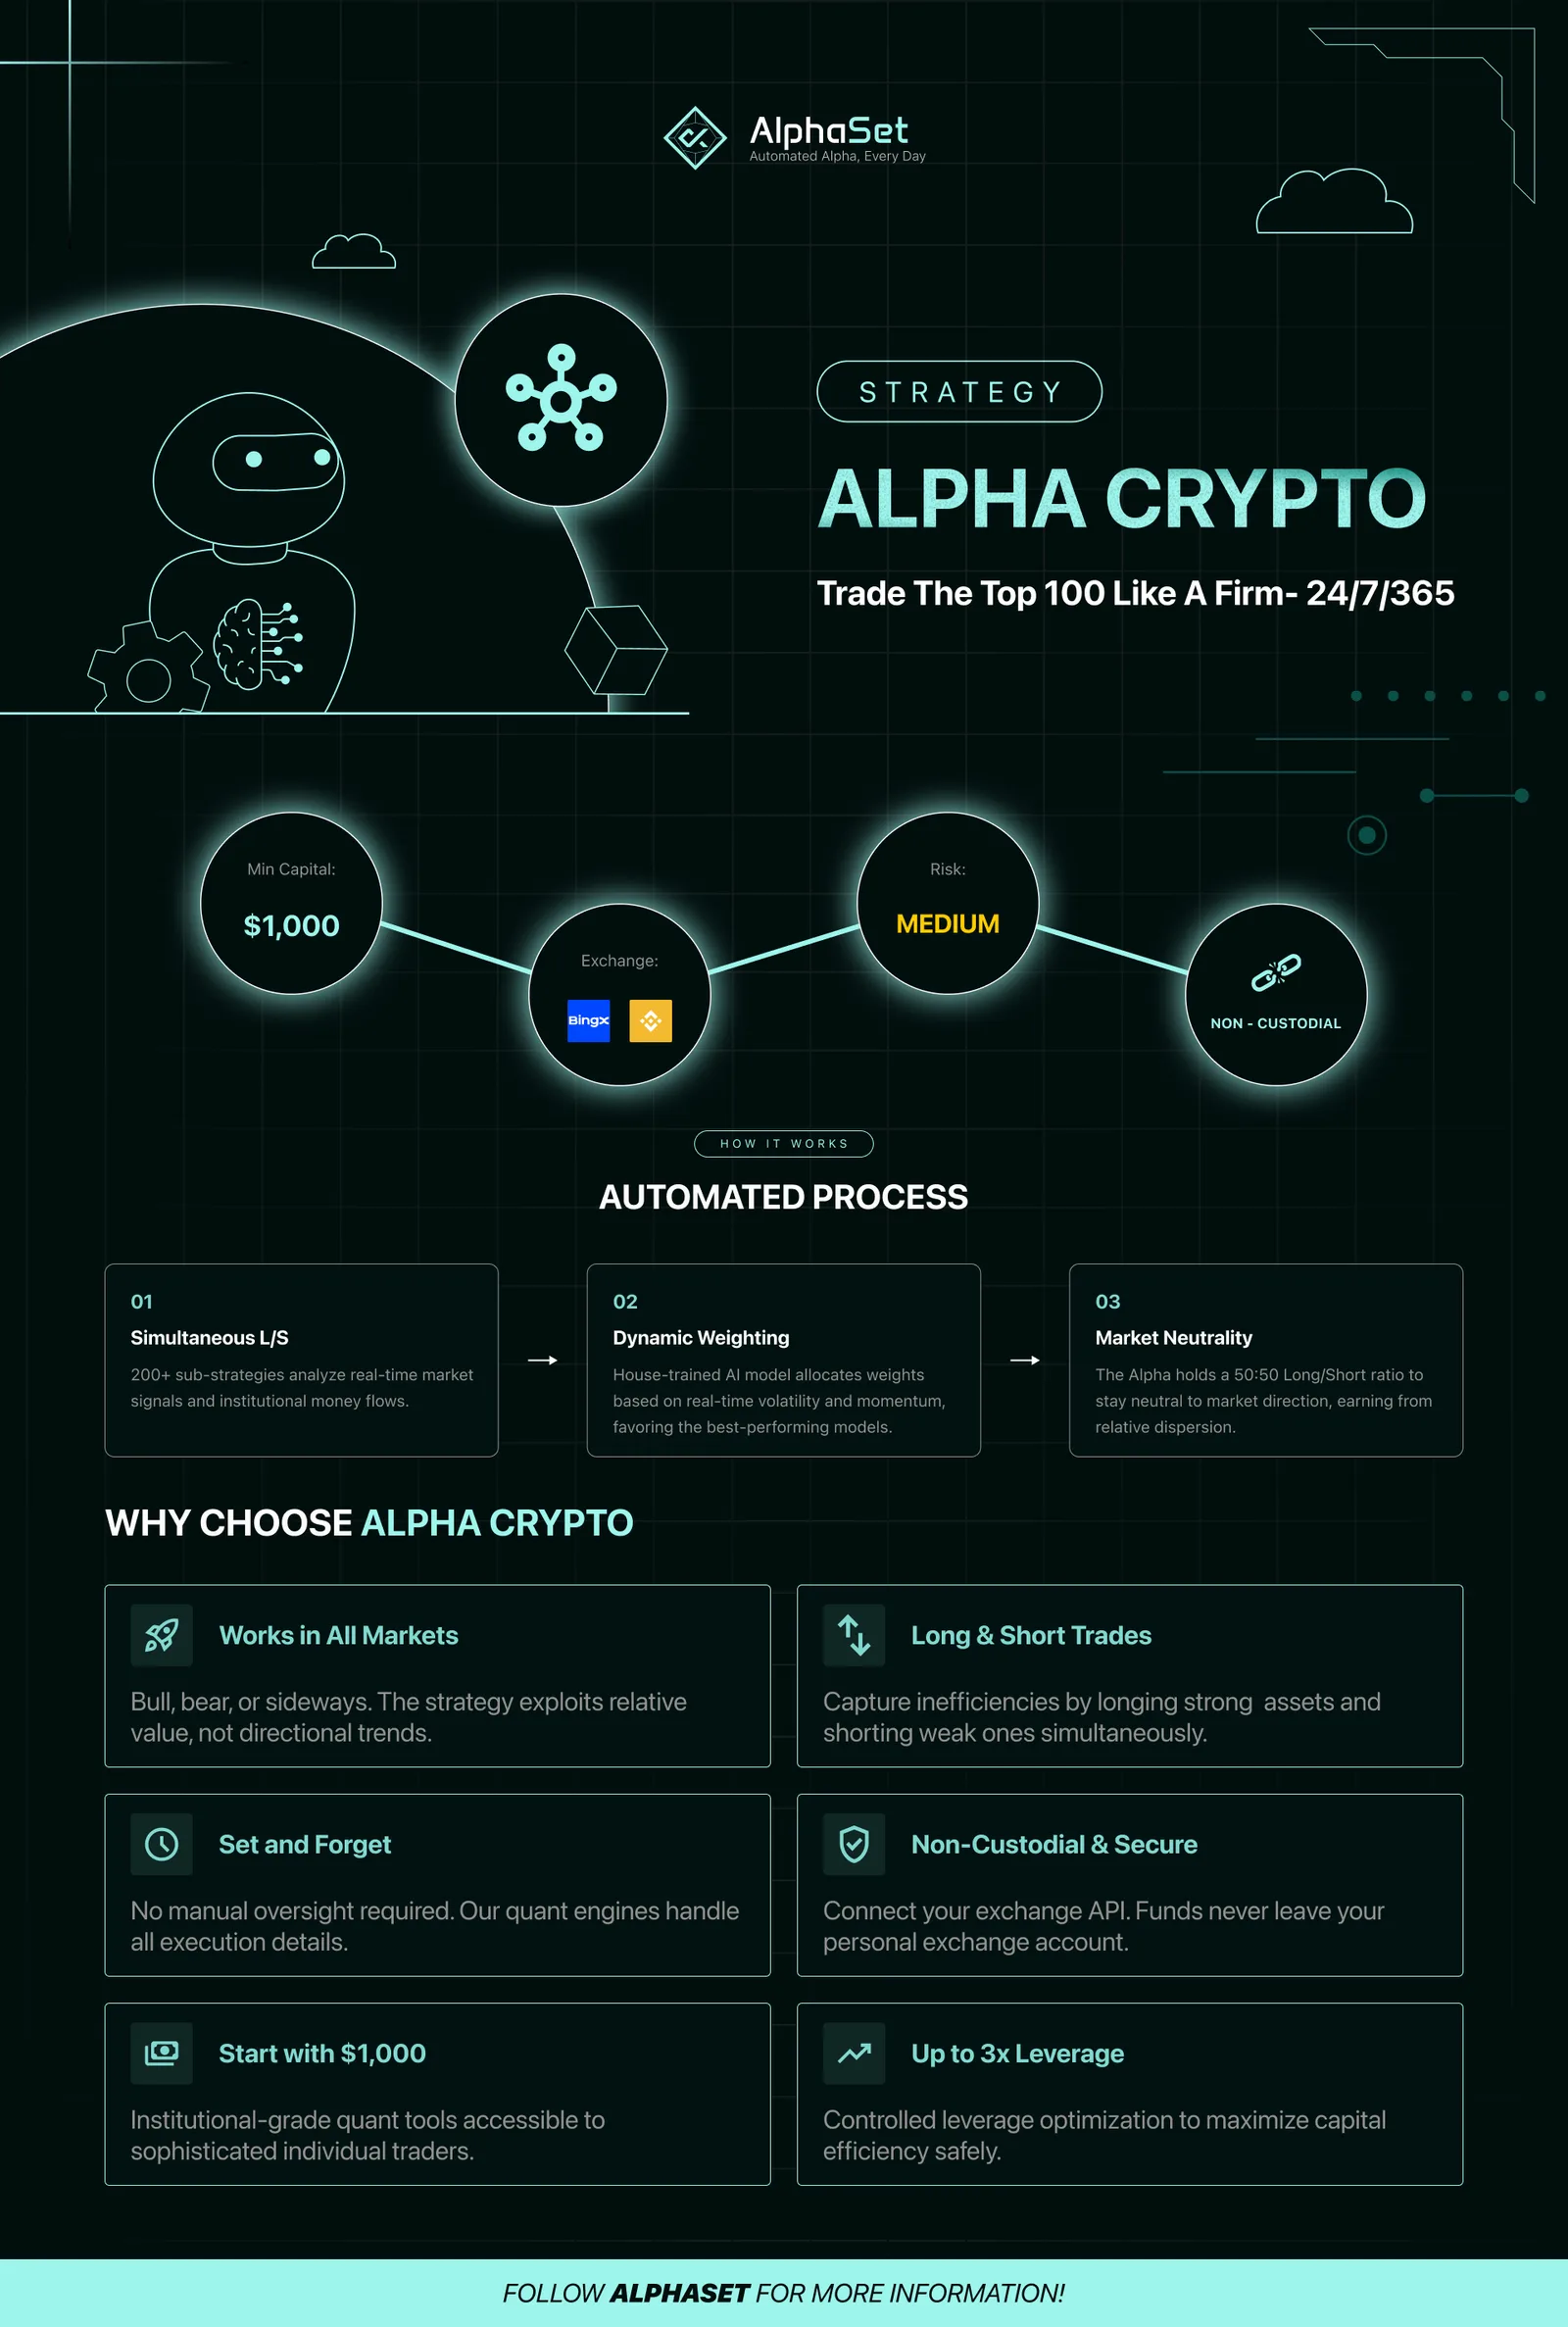
Alpha Crypto is AlphaSet's automated long/short trading strategy across the top 100 coins by market capitalization — built on AlphaSet, a quantitative investment platform designed for individual investors.
Unlike simple buy-and-hold, Alpha Crypto scores all 100 coins, buys the strongest and short-sells the weakest, allowing you to generate returns in both market directions rather than waiting for prices to rise.
The long/short ratio adjusts automatically based on market conditions, driven entirely by data and free from emotional bias. Everything runs 24/7 via API on your exchange account — your funds remain on the exchange, and AlphaSet has order-placement rights only, with no withdrawal access.
Alpha Crypto Reports the Full Metric Set — Not Just % Return
AlphaSet is a quantitative investment platform that connects via API to your exchange account. Alpha Crypto tracks and reports the complete picture: return, max drawdown, Sharpe Ratio, Calmar Ratio, win rate, and month-by-month consistency. Users do not need to calculate anything themselves — everything is displayed transparently so you can assess strategy quality accurately.
The key advantage of a computer-driven algorithm over human judgment is that the engine is never fooled by a short-term spike in returns if it detects that drawdown metrics are quietly deteriorating. The system continuously scans and measures both return and risk in real time, automatically scaling position size up or down to protect your capital to the greatest extent possible.
Investing with AlphaSet, you pay a fixed monthly subscription fee — all profits are yours, with no performance fees.
Ready to outperform with AlphaSet?
Activate the AlphaSet strategy today and let our quants manage your exchange sub-accounts automatically.
Activate Alpha Crypto