

Cross-sectional ranking: how to rank stocks by relative performance
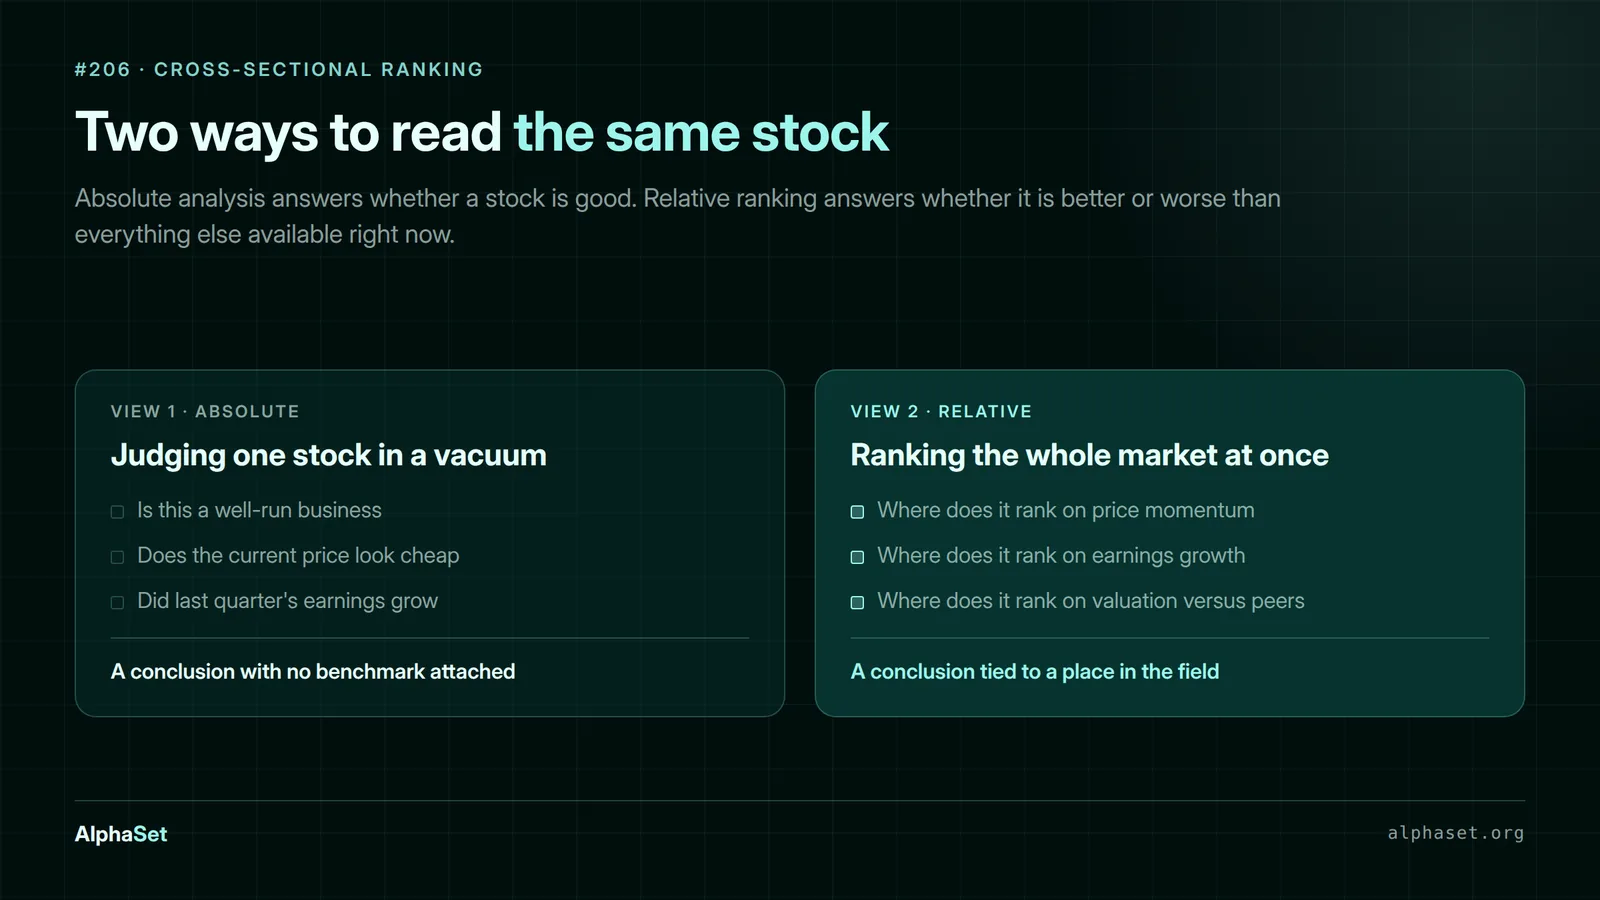
When selecting stocks to invest in, most people look at each stock individually: is this company good, is the price cheap, is earnings growth strong? This is a vertical approach — evaluating a stock against itself. Instead of asking "is this stock good," cross-sectional ranking is an approach that asks "is this stock better or worse than all the other stocks in the market right now."
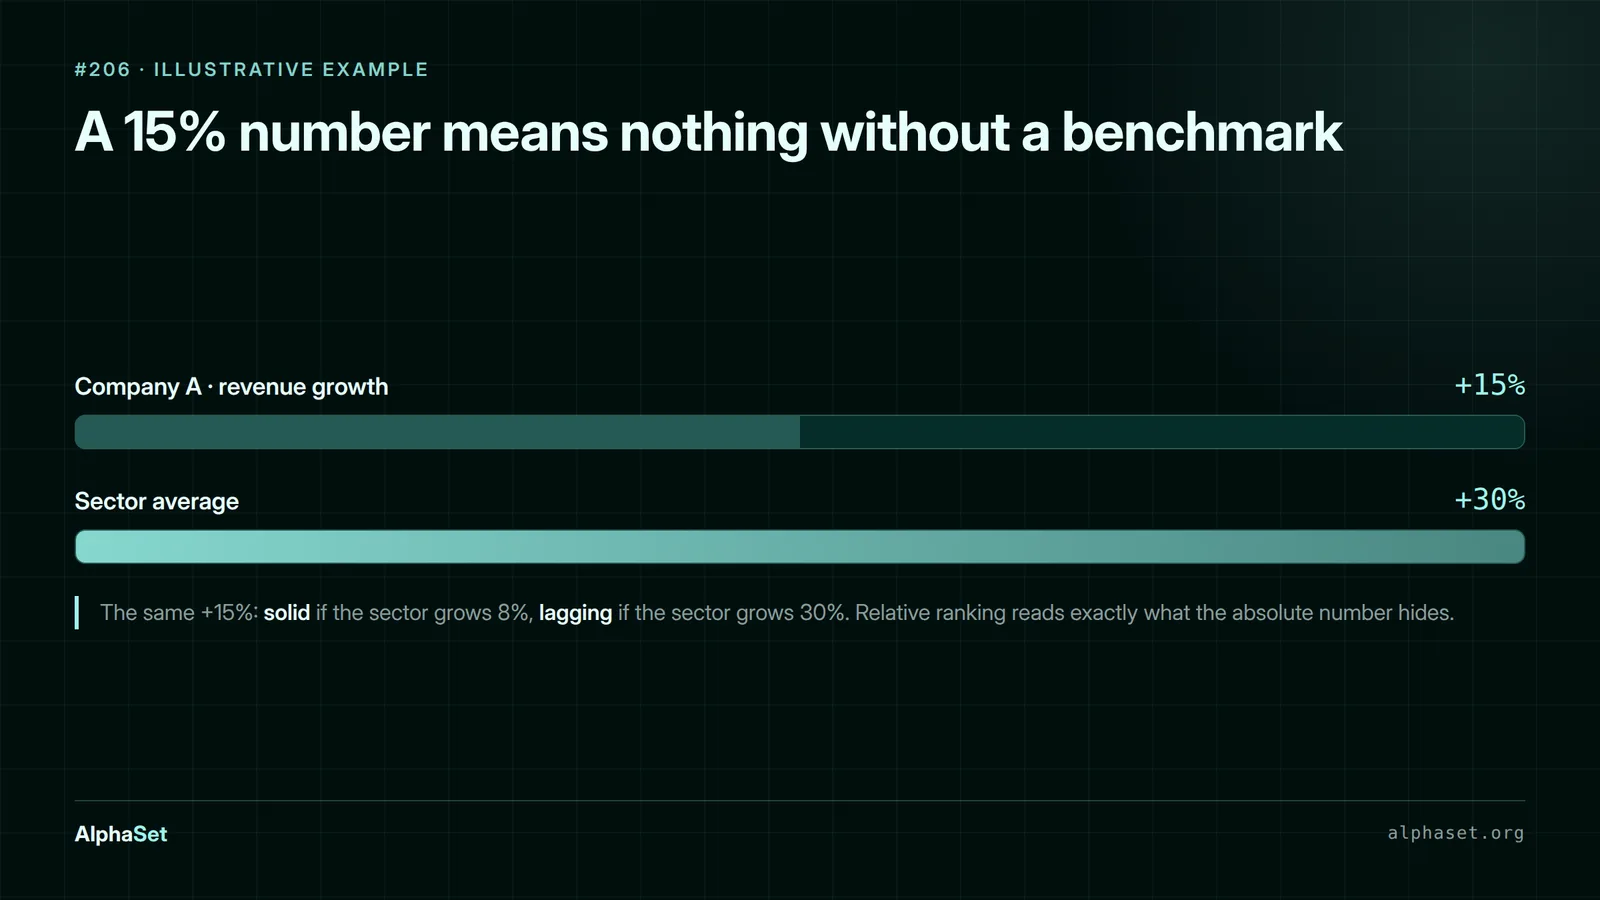
Say you find a company that grew revenue 15% over the year. Sounds decent.
But if the entire sector is growing at 30%, the company you picked is actually falling behind its own peers. The 15% figure isn't wrong — it just doesn't tell you the most important thing: where that ticker actually stands.
The same applies to price. A stock up 10% over the past month could be a good signal or a bad one. If the broader market rose 20% in that same month, your pick is underperforming the average — even if your account is still in the green.
What is cross-sectional ranking?
Cross-sectional ranking is a method of simultaneously ranking all stocks in a tracked universe at the same point in time, rather than evaluating each ticker independently.
The question shifts from "is this stock good?" to "how much better or worse is this stock than the percentage of all other stocks in the market right now?"
How does cross-sectional ranking work?
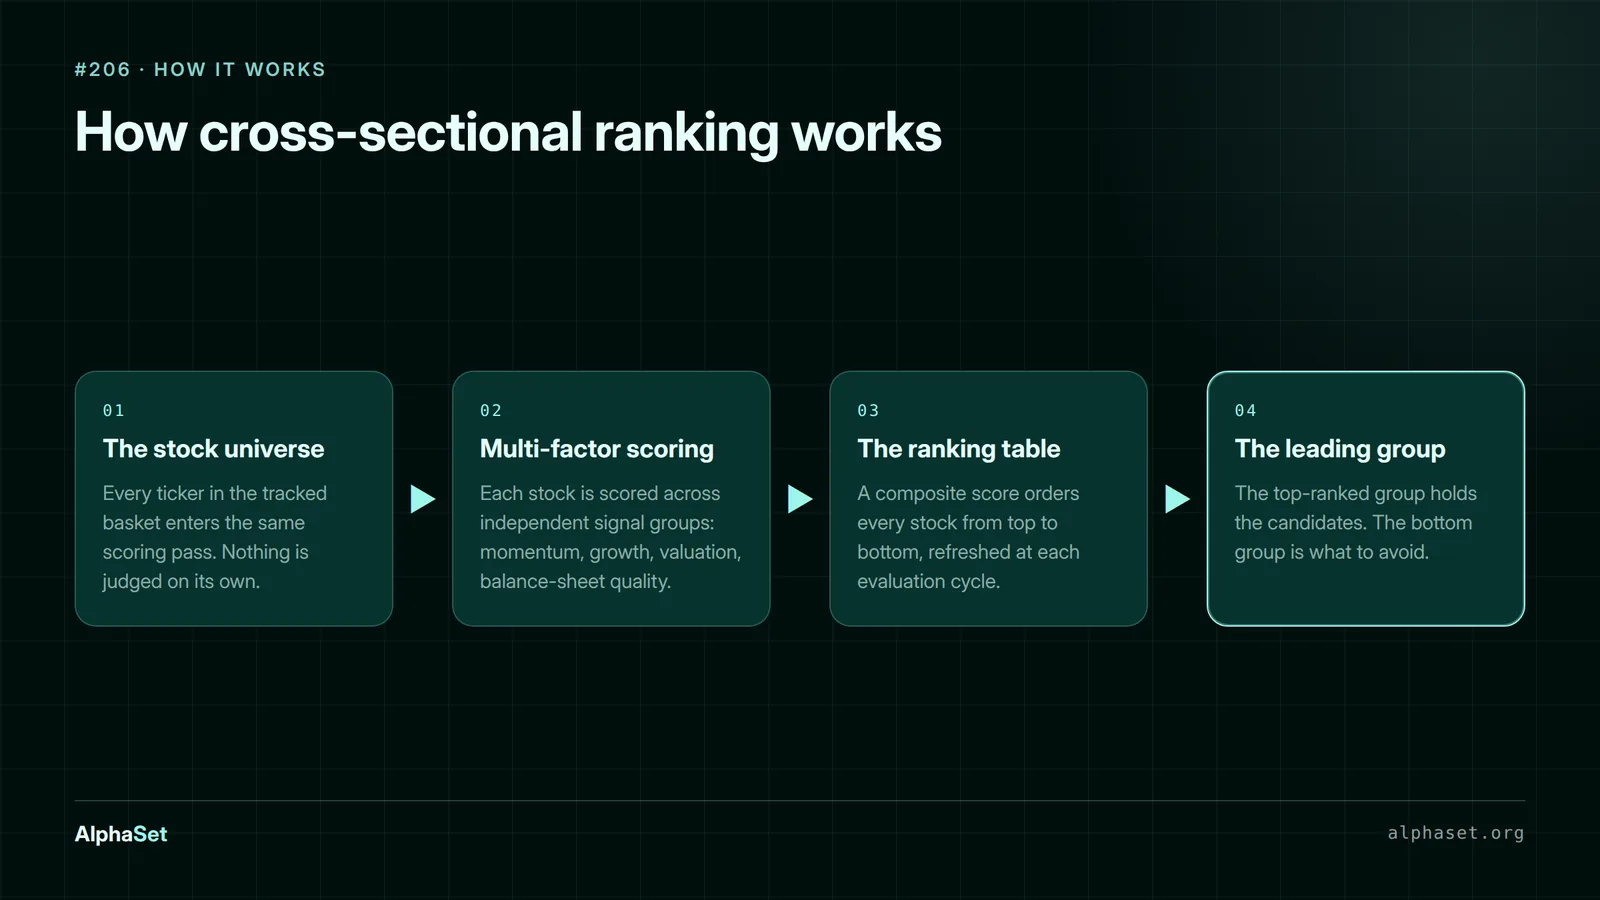
At each point in time, all stocks in the investment universe are ranked simultaneously across multiple criteria: price momentum, earnings growth, relative valuation, balance sheet quality, and other factors. Each stock receives a composite score reflecting its position relative to the entire universe.
The result is a continuously updated ranking table. The highest-scoring group are long candidates; the lowest-scoring group may be candidates to avoid or short.
Why does relative ranking matter more than absolute values?
When a fund decides to deploy capital, they don't ask "is this stock fine?" They ask "among everything I can buy today, which ticker deserves the allocation most?" If fifteen stocks in the same sector are growing faster, the one growing 15% won't make the buy list — even if there's nothing inherently wrong with it.
This is why a "good" stock can go sideways for an entire year while the broader market moves up. It doesn't underperform because the business is poor. It underperforms because better alternatives existed at the same time.
Relative ranking also helps you avoid another trap. In a strong bull market, almost every ticker looks good on paper, and the feeling that "everything is fine" makes stock selection arbitrary. A ranking table forces every ticker to compete directly against the others, so only the genuine leaders make it into the portfolio.
The reverse is equally true. In a declining market, everything looks bad — but there is always a group that drops far less than the rest. That group typically recovers before the market turns.
Can you build cross-sectional ranking yourself?
In theory, the process isn't overly complex — but in practice, you'll run into four real problems:
-
First: data volume. Ranking 100 tickers across five factor groups means 500 data points to collect, clean, and refresh at every evaluation period.
-
Second: normalization. Adding a percentage figure directly to a revenue figure in billions produces a meaningless result. Every factor must first be rescaled to a common measure, and this step determines most of the ranking's quality.
-
Third: consistency. A ranking table only has value when it is recalculated regularly under the same rules. Running it once and dropping it halfway is worse than not running it at all, because you'll be making decisions based on a stale ranking.
-
Fourth: discipline. The ranking will sometimes tell you to reduce exposure to a position you're profiting on, or to buy a ticker you feel uncomfortable with. That's exactly the moment most people who build this themselves quietly make an exception.
Alpha Stock VN: Automated trading for VN30 equities & derivatives — done right
What is Alpha Stock VN?
Alpha Stock VN is AlphaSet's quantitative investment strategy for the Vietnamese stock market — a quant investment platform built for individual investors.
The AlphaSet team has over 10 years of experience developing quantitative trading strategies, previously managing $80 million for funds in Dubai, UAE, and has processed a total of over $200 million in assets across multiple cycles with more than $10 billion in live trading volume since 2016.
AlphaSet serves traders ranging from professional to semi-professional, participating in digital asset markets (spot/futures/XAU) and the Vietnamese stock market, helping individual users trade automatically with impressive real-world APR.
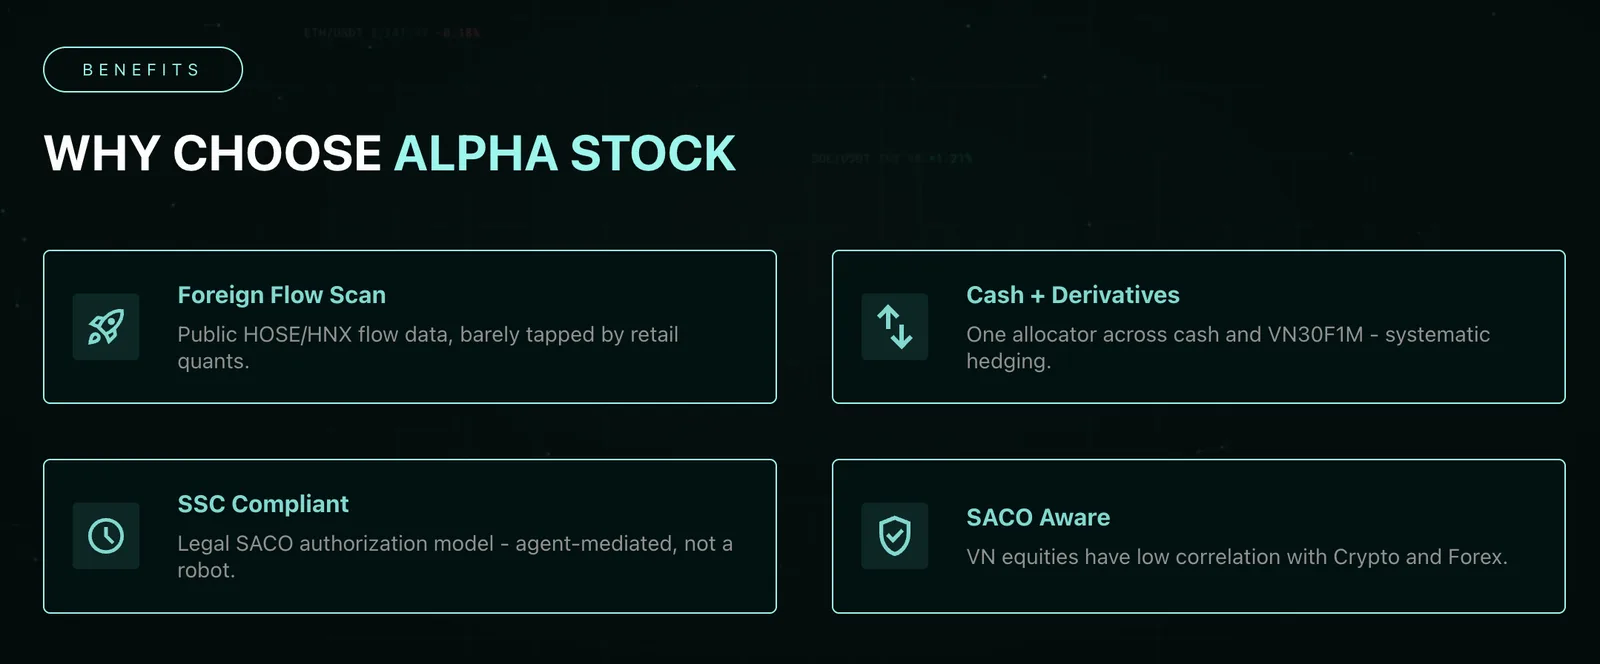
Users don't need to know how to code, don't need complex setup, and don't need to watch charts continuously — they can still trade effectively through AlphaSet. Simply connect AlphaSet to your brokerage account via API, select the AlphaStock strategy, and let the system trade automatically 24/7.
Unlike buying and holding on your own, Alpha Stock VN scores and ranks tickers in the VN30/VN100 universe using a multi-factor system, prioritizing stocks supported by large capital flows, while using VN30F1M futures contracts to trade both directions or hedge when the market declines.
How does Alpha Stock VN work?
Instead of spending your own time researching hundreds of stocks, reading financial reports, and watching every minute to place orders, you simply subscribe to AlphaSet's service and connect it to your DNSE account. The entire analysis and order-placement process is then executed automatically by the system — directly within your own account.
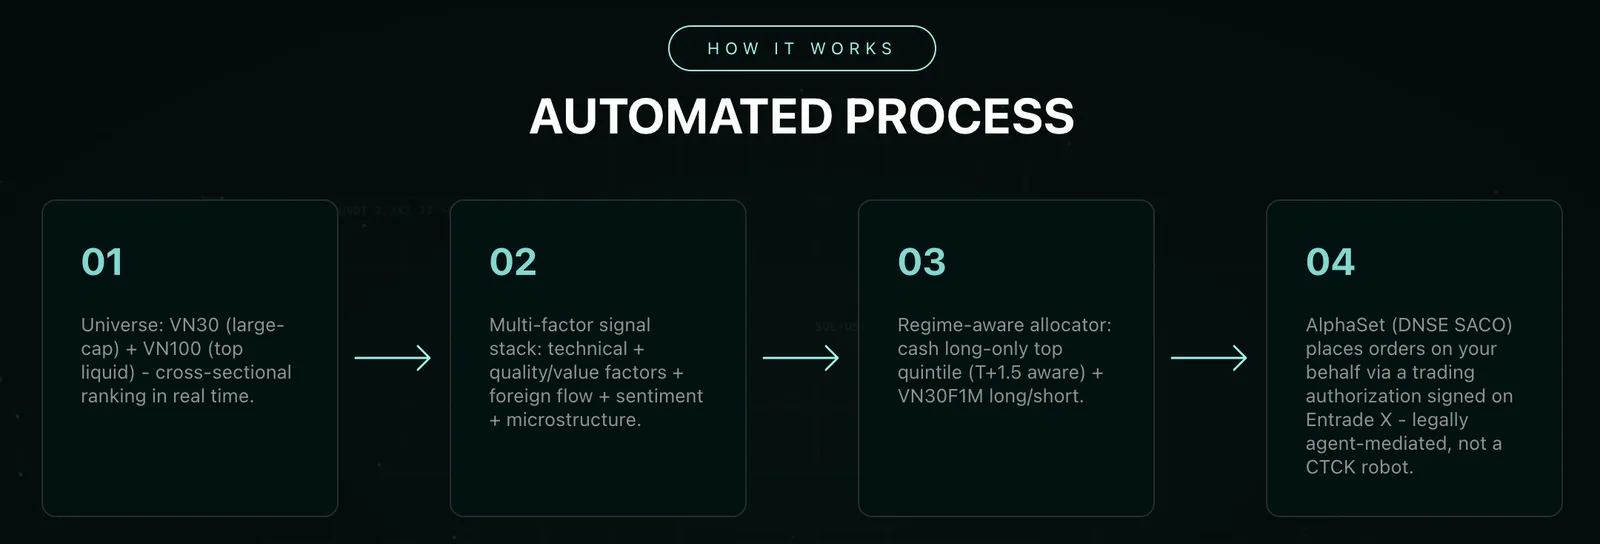
AlphaSet's algorithm scores and ranks tickers in the VN30/VN100 universe based on four signal groups: technical, fundamental factors, foreign institutional flow, and market sentiment. From that ranking table, a single capital allocator splits funds between two segments:
- Equities: Buys only the strongest-ranked tickers, trading on a T+1.5 settlement cycle.
- VN30F1M derivatives: Goes long or short according to the trend, with approximately 5.4× leverage. For derivative trading, the engine combines trend signals and technical signals to determine when to go long and when to go short.
Every decision is data-driven, every position has a predefined stop-loss, and execution is fully automated — unaffected by emotion or rumor when the market moves. The goal is not to beat the market in every session, but to consistently accumulate alpha (the portion of return that exceeds the market) across multiple cycles — something most individual investors trading manually find very difficult to achieve.
Your assets remain yours. Funds always stay in your own brokerage account; AlphaSet has no authority to withdraw or transfer them. Authorization only permits order placement, and you can revoke it at any time directly within the account management application.
Ready to outperform with AlphaSet?
Activate the AlphaSet strategy today and let our quants manage your exchange sub-accounts automatically.
Activate Alpha Crypto